Urban heat and tree canopy mapping
Understanding the extent of tree canopy, green spaces, permeability, building footprints and urban heat across our city.
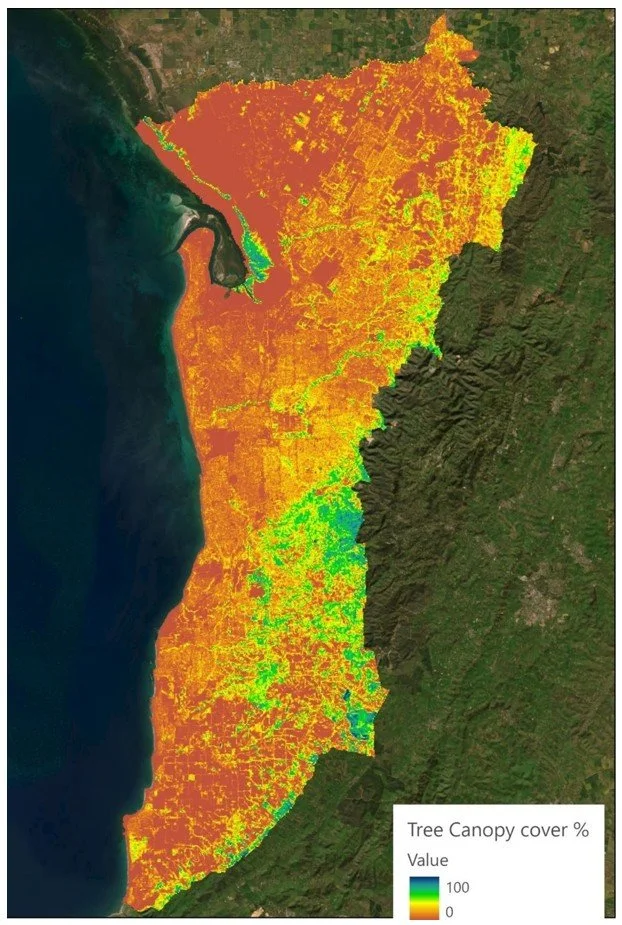
Tree canopy cover across Adelaide
Tree Canopy Mapping Project Across Metro Adelaide
Adelaide's changing climate requires understanding its green spaces and built-up areas. The Urban Heat and Tree Mapping study, using council data from 2022, identified the city's hottest zones and where more vegetation could boost liveability.
The project mapped tree canopies (trees over 3m tall), green spaces, impervious surfaces, and urban heat islands—areas where artificial surfaces like roads and buildings retain heat. These heat islands, defined as spots at least 2°C warmer than average (or 3–4°C for 'extreme' areas), raise local temperatures, especially during heatwaves, impacting health and comfort.
Impermeable surfaces prevent moisture from cooling the environment, while trees and grass help reduce heat through shade and evaporation. Increased built-up areas lead to higher temperatures, especially at night.
Key 2022 findings for metro Adelaide:
· 16.7% covered by tree canopy (around 13,000 times Adelaide Oval)
· 29% made up of impermeable surfaces (roads, buildings, hard areas)
· 67% consists of permeable surfaces (bare earth, grass, vegetation)
For more information:
https://www.greenadelaide.sa.gov.au/projects/urban-heat-and-tree-canopy-mapping
https://data.environment.sa.gov.au/Climate/Data-Systems/Urban-Heat-Mapping/Pages/default.aspx